My research lies at the cross-roads between neuroscience, complex networks and dynamical systems. It is the result of bidirectional interactions and mutually feeding motivations between those three cornerstones.
Center for Brain and Cognition
Computational Neuroscience Group
Pompeu Fabra University, Barcelona


Research Highlights
Brain connectivity
As an undergraduate physics student, I wondered why those bulky neuroscience textbooks of my friends at medicine school devoted so many pages to describe the gray matter – a layer of tissue one millimetre thin – but only dedicated only a handful pages to the white matter, a tissue that occupies about half of the volume of the brain.
Today, we know that the white matter is the “internet of the brain“: a vast network of cables that allows the communication between different parts of the brain and cortex. My work has helped to better understand this intricate network of communications. Building upon previous seminal works, and based on the cortico- cortical connectivity of cats, we identified that cortico-cortical networks have a modular but centralised architecture, with few regions – the rich-club – centralising those communication paths.
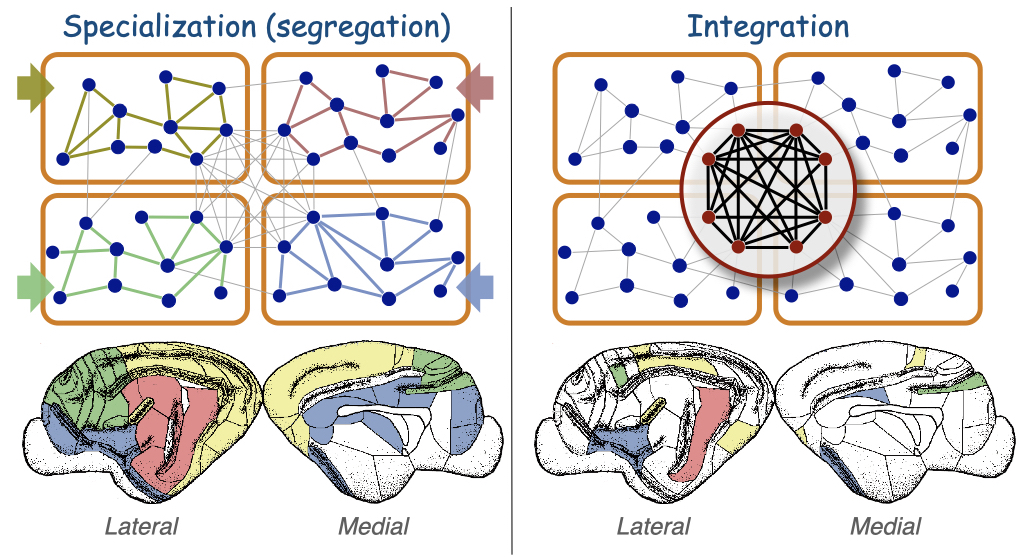
Accordingly, we proposed the idea of a dualistic function in which the modules are the product of specialised sensory processing (e.g., vision or audition) while the hubs forming the rich-club may have the capacity for multisensory integration. Although, looking at the individual regions we found a graded distribution, rather than a clear-cut separation, in terms of the function each region may take between specialization and global integration. Thus classifying cortical regions approximately into three categories in respect their participation across sensory modalities: unimodal regions (highly specialised), multimodal areas and supramodal hubs (global integrators).
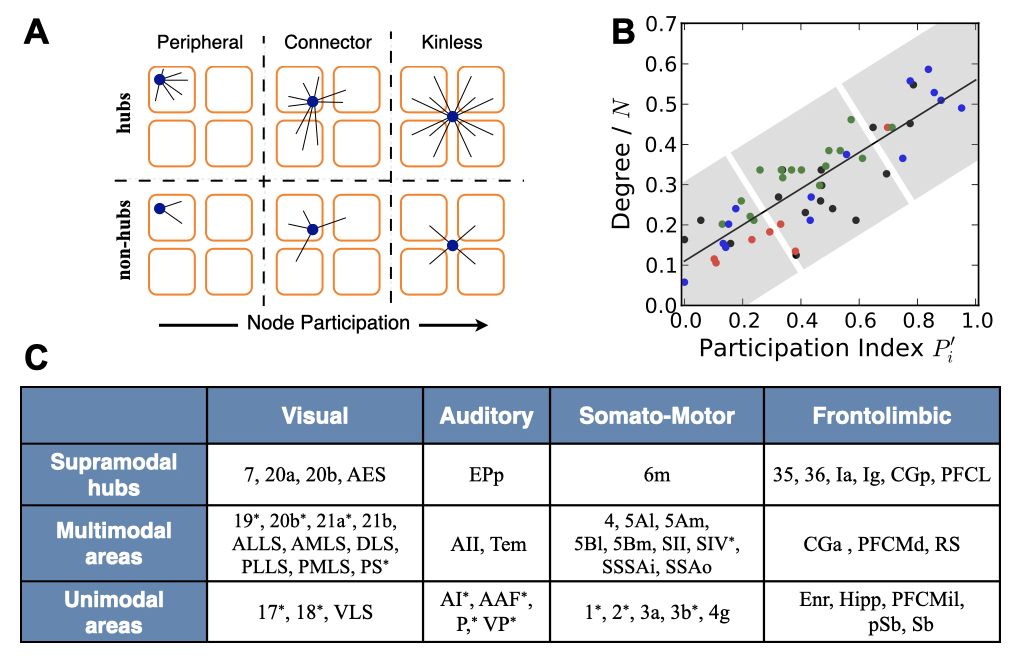
The same kind of modular and centralised architecture has been identified in other species such as humans, macaque monkey, ferrets and even in the C. elegans, a small worm whose entire nervous system consists of 302 neurones.
- Linking structure and function of complex cortical networks.
G. Zamora-López. Ph.D. dissertation, University of Potsdam (2009). - Cortical hubs form a module for multisensory integration on top of the hierarchy of cortical networks.
G. Zamora-López, C.S. Zhou, & J. Kurths. Front. Neuroinform. 4:1 (2010). - Exploring brain function from anatomical connectivity.
G. Zamora-López, C.S. Zhou & J. Kurths. Front. Neurosci. 5:83 (2011).
One brain, many states
If the brain is a vast network of interacting regions, then how much is the functional interaction between brain regions determined by the underlying architecture? Shall we find a one-to-one reflection of its anatomical organization at the functional level? From a dynamical perspective the network of interactions between brain regions is usually measured as the level of synchrony or statistical correlations between their activity signals. Such networks are called functional connectivity.
While much research has directly compared the anatomical and the functional connectivities expecting to find a 1-to-1 relation, we could show that anatomy does not fully explain pair-wise functional relations between brain regions. In other words: “anatomy shapes functional connectivity but it does not determine it”. Although such dissociation between structure and function may seem counter-intuitive at first, we could explain – using a simple heuristic dynamical model – that functional connections in the brain depend on several ingredients and anatomy is only one of them. The collective dynamics also depend on the type of local behaviour expressed by the regional populations and by the manner they pass information between each other.
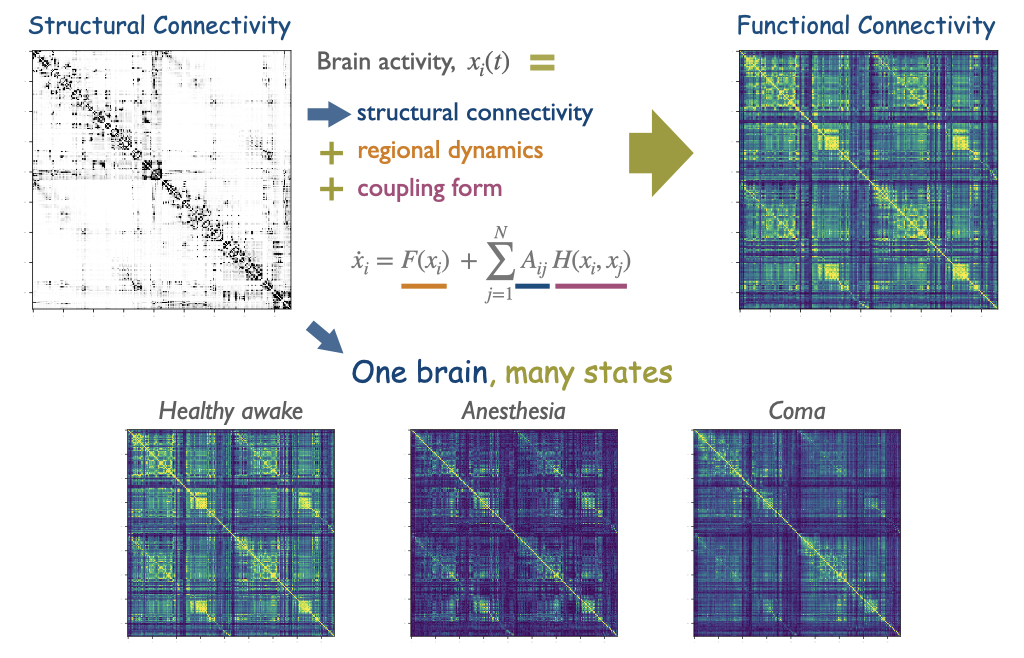
Recent studies have supported this explanation by highlighting the idea of “one brain, many states.” That is, while we only have one brain – a unique anatomical connectome – brain activity looks different depending on whether we are awake, performing a task, sleeping or undergoing general anesthesia. Each of those states are thus characterised by different patterns of functional connectivity.
The origin of these differences is due to changes in the local activity of the neural populations, while the anatomy remains unaltered. Indeed, latest results have shown that structural and functional connectivities are closest only during loss of consciousness, as the regional dynamics dissipates and direct anatomical connections become the dominant factor. During conscious awake, more intrincate regional dynamics trigger a dissociation of the functional connectivity from the shape of the underlying structure.
- How structure sculpts function: unveiling the contribution of anatomical connectivity to the brain’s spontaneous correlation structure.
R.G. Bettinardi, G. Deco, et al. Chaos 27, 047409 (2017). - Signature of consciousness in brain-wide synchronization patterns of monkey and human fMRI signals.
G. Hahn, G. Zamora-López, L. Uhrig, et al. NeuroImage 226, 117470 (2020). - Loss of consciousness reduces the stability of brain hubs and the heterogeneity of brain dynamics.
A. López-González, R. Panda, et al. Commun. Biol. 4:1037 (2021).
How small is a small-world network?
The small-world phenomenon is a central feature of complex networks, present in both natural and man- made networks. It was first defined in the realm of social sciences during the 1960s from the observation that any two persons in the world are connected through a short chain of social ties. But, how small is a small- world network and how does it compare to others?
Usually, in the physical world we interpret the size of objects by comparing them to a common reference – a standard metric space defined and agreed by the community. In the case of complex networks this is not possible since every network constitutes its own space. Thus, the question of whether a network is smaller or larger than another implies the comparison of two different spaces with each other, rather than the more familiar situation in which two objects are contrasted within the space they live.
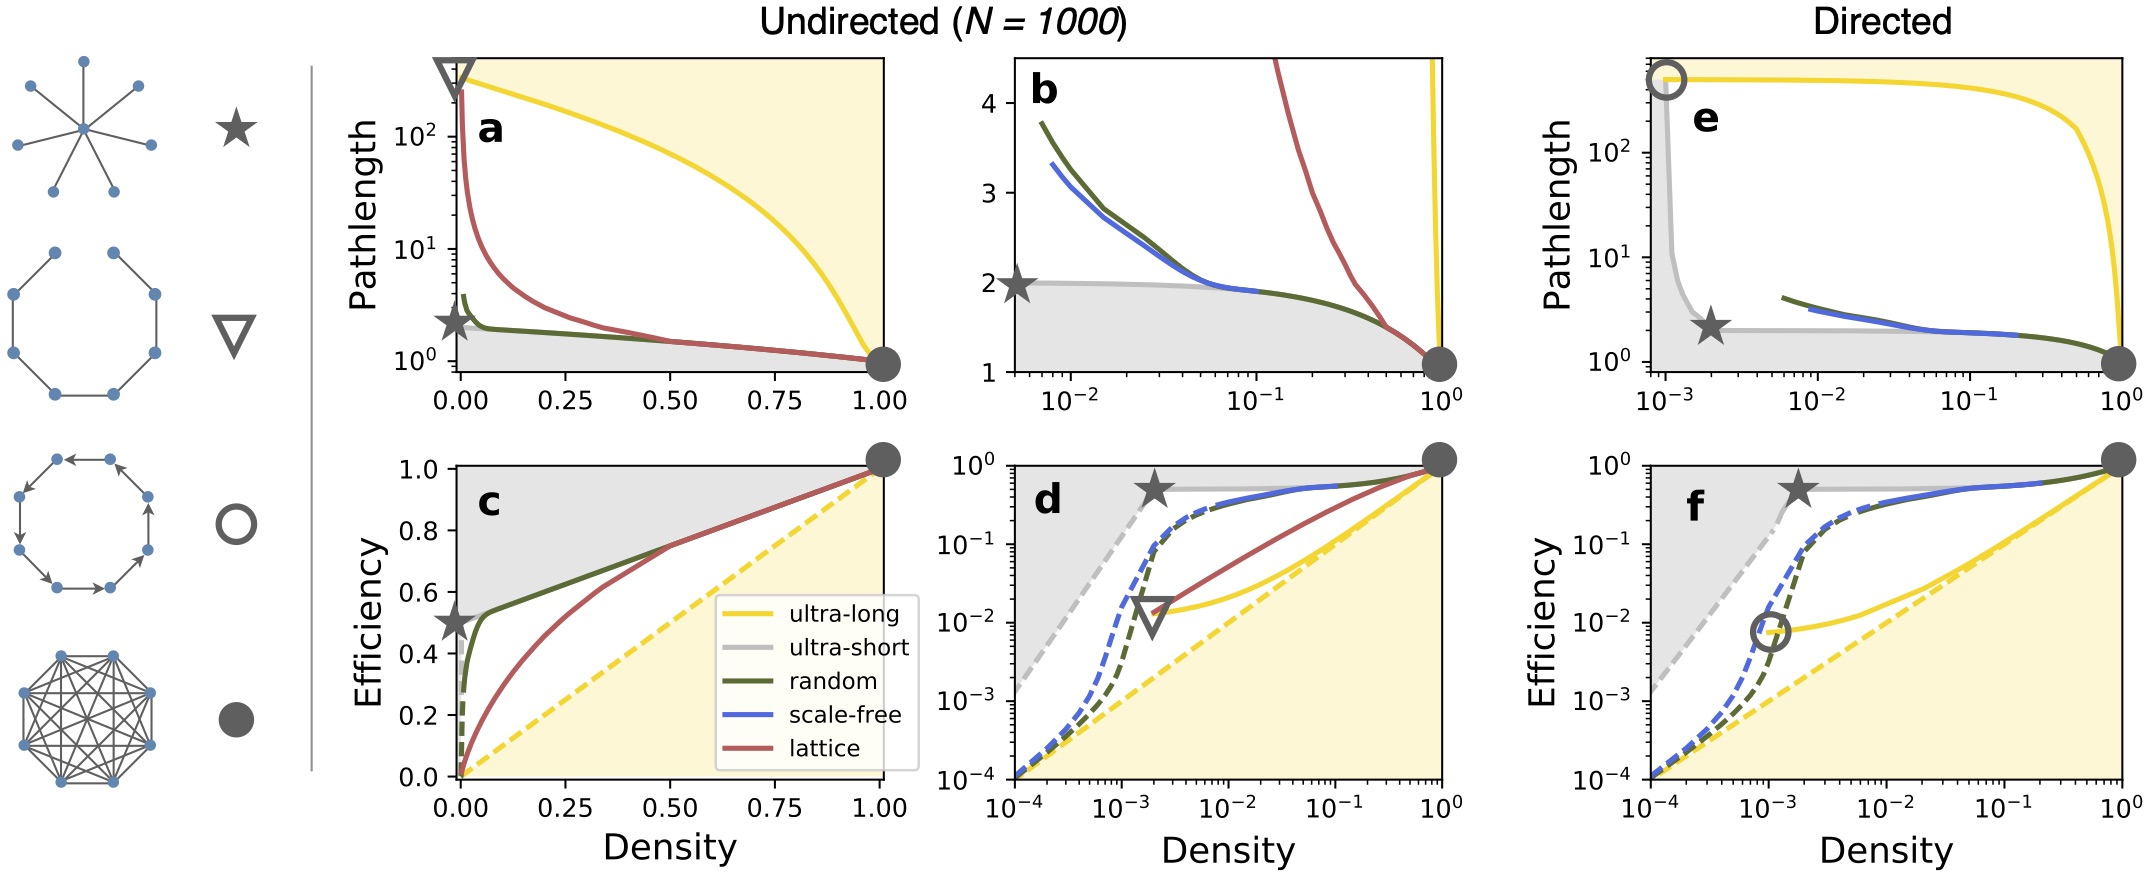
In order to overcome this problem we identified the limits of the average pathlength and the global efficiency. That is, for an arbitrary number of nodes N and number of links L, we could define how to construct a (directed) graph with the shortest possible or the longest possible pathlength. This allows to evaluate the small-worldness of any network by observing how far is the network from its natural lower and upper boundaries. Additionally, we could show that all graph models (e.g., random, scale-free and lattices) become small-world at sufficient link density, with this critical density being a specific characteristic of the model.
- Sizing complex networks.
G. Zamora-López & R. Brasselet. Nature Comms. Phys. 2:144 (2019). - PathLims, A Python package to generate ultra-short and ultra-long (di)graphs.
